Project Details
Sales and Demographic Insights on Mortgage Data
Project Overview
The Sales and Demographic Insights project aimed to analyze, visualize, and present data to extract meaningful business insights. This comprehensive initiative leveraged various tools, including Microsoft Excel, Tableau, Lucidchart, and PowerPoint, to ensure a thorough understanding and effective communication of the findings.
This is a virtual internship project by JP Morgan Chase & Co. on Forage

Situation
Focusing on a home loan dataset containing approximately 500 data points, the project aimed to identify key trends and insights that could inform sales strategies and improve business operations. The dataset was cleaned and processed to ensure accurate and reliable analysis.

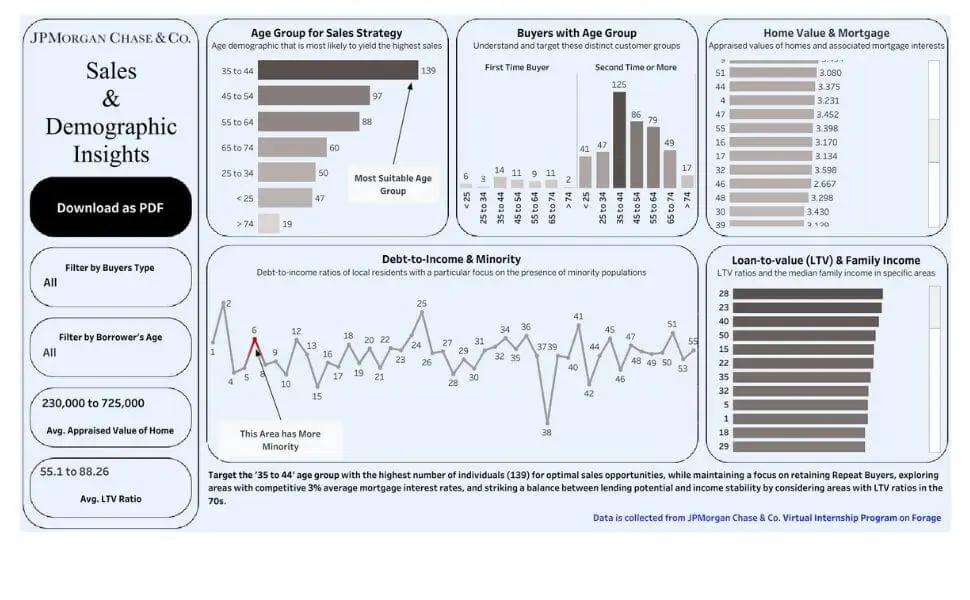
JP Morgan Chase & Co. Mortgage Data Analysis Dashboard
Task
The primary task was to perform a detailed data analysis and create visualizations to uncover actionable insights. This involved:
- Data Analysis using Microsoft Excel
- Data Visualization Dashboard using Tableau
- Creating a Process Map using Lucidchart
- Storytelling with PowerPoint
- Updating Project Progress through Video
The analysis spanned various dimensions:
- Age groups influencing sales strategy
- Buyer demographics
- Home value mortgages
- Debt-to-income ratios in minority-prone areas
- Loan-to-value ratios paired with median family incomes
Action
Data Analysis using Microsoft Excel
- Preparation: Cleaned and processed the home loan dataset to ensure it was ready for analysis.
- Visualization: Created pivot charts for visual representations of the data.
- Analysis: Derived insights on loan-to-value ratios, borrower income ranges, and trends among first-time and second-time buyers.
Data Visualization Dashboard using Tableau
- Modification: Adapted the dataset for use in Tableau.
- Design: Used Figma to design a visually appealing background for the dashboard.
- Creation: Built interactive visualizations and a dynamic dashboard in Tableau to showcase various insights related to the dataset.
Result
The comprehensive approach to analyzing and visualizing the data yielded several key insights:
- Loan-to-Value Ratios: High demand for mortgages within a specific range, suggesting opportunities for lenders to offer competitive rates and terms.
- Borrower Income: Recommendations for affordable loan products to attract low-income borrowers.
- Market Trends: Higher number of second-time buyers compared to first-time buyers, indicating a potential market trend.
- Home Values: Home values are normally distributed, with an average value of approximately $430K.
- Demographics and Sales Strategy: The most suitable age group to target for sales is 35-44, with a high number of both first-time and second-time buyers.
- Area-Specific Insights: Key demographics and economic indicators in various area codes, such as debt-to-income ratios and average home values.
Notable insights included:
- Concentration in the 35 to 44 age range for sales strategy.
- Varied trends in first-time and repeat buyers across age groups.
- Opportunities for targeted financial solutions and community engagement in minority-prone areas.
- A holistic view of economic landscapes through loan-to-value ratios and median family incomes.
This structured and detailed analysis provided a robust foundation for informed decision-making and strategic planning.